
![]()
[Apr 04, 2026] Fully Updated Free Actual Snowflake DAA-C01 Exam Questions
Free DAA-C01 Questions for Snowflake DAA-C01 Exam [Apr-2026]
NEW QUESTION # 24
How do diverse chart types (e.g., bar charts, scatter plots, heat grids) contribute to effective data presentation and visualization in reports and dashboards?
- A. Diverse chart types restrict data exploration in reports and dashboards.
- B. Charts don't impact data visualization in reports or dashboards.
- C. Different chart types offer varied data representation for better analysis.
- D. They limit data representation options for simplicity.
Answer: C
Explanation:
Different chart types offer varied data representation, aiding better analysis in reports and dashboards.
NEW QUESTION # 25
A marketing team requires a daily report showcasing website traffic, conversion rates, and cost per acquisition (CPA). They want to receive this report as a CSV file attached to an email. The data is stored in a Snowflake table 'WEB ACTIVITY with columns 'DATE , 'VISITS, , and SPEND. Which of the following steps, combined and executed in the correct order, would be the MOST efficient and secure way to automate this report delivery?
- A. Create a Snowflake Alert that triggers when the 'WEB ACTIVITY table is updated. The alert executes a stored procedure that queries the data, formats it as CSV using Snowflake Scripting, writes the CSV to an internal stage, and then uses a Python UDF to send the email with the CSV attachment. Grant the alert necessary privileges.
- B. Create a Snowflake Task that executes a stored procedure. The stored procedure uses a Snowflake Scripting block to query the data, format it as CSV using Javascript UDF, writes the CSV to an internal stage, and then uses a Java UDF (Util.EmailSender) to send the email with the CSV attachment. Grant necessary permissions to the task's service account to access the stage and execute the UDFs.
- C. Create a Snowflake Stream on the 'WEB ACTIVITY table. When data changes are detected, trigger an external function (e.g., AWS Lambda) via a pipe. The Lambda function queries the data, formats it as CSV, uploads the file to S3, and sends an email with a download link.
- D. Create a scheduled task in an external orchestrator (e.g., Airflow). This task uses the Snowflake Python connector to query the data, format it as CSV, writes the CSV to an external stage (e.g., AWS S3), and then uses an email service (e.g., AWS SES) to send the email with the CSV attachment. Configure appropriate IAM roles for Snowflake to access S3.
- E. Use a third-party reporting tool (e.g., Tableau, Power Bl) to connect to Snowflake, create the report, and schedule it for daily email delivery with a CSV attachment. Configure the tool with the appropriate Snowflake connection details and credentials.
Answer: D
Explanation:
Option B is the most efficient and scalable. Using an external orchestrator provides better scheduling control and separation of concerns. Writing to S3 allows for easier integration with other external services. Python connector is preferred for data transformation and CSV generation compared to Snowflake scripting. Utilizing AWS SES for email delivery scales well and aligns with a cloud-native approach. Option A is viable but can be resource-intensive within Snowflake. Options C, D and E are less efficient due to relying on event-based triggers or third party tools for scheduling and email delivery. Option D exposes the data to a third-party tool. Option E requires complex setup and is not the best choice for a simple daily report.
NEW QUESTION # 26
You are building a real-time dashboard to monitor website traffic and user behavior for an e-commerce company. The data includes page views, clicks, add-to-carts, and purchases, streamed continuously into Snowflake. You need to visualize the conversion funnel (page views -> clicks -> add-to-carts -> purchases) in real-time and identify drop-off points. Given the following table schema: "'sql CREATE OR REPLACE TABLE website_events ( event_timestamp TIMESTAMP NTZ, event_type VARCHAR(50), user_id VARCHAR(IOO), page_url VARCHAR(255) ); Which approach, including code snippets, would be the MOST efficient and scalable way to achieve this real-time conversion funnel visualization, taking into account the high volume of streaming data?
- A. Load all 'website_eventS table data into Python Pandas dataframes and use libraries to find the conversion rate in real time.
- B. Export the 'website_events' data to a message queue (e.g., Kafka) and use a stream processing framework (e.g., Flink) to calculate conversion funnel metrics. Then, load the results into a separate table in Snowflake and visualize it using a BI tool.
- C. Periodically query the 'website_events' table every 5 minutes, calculate conversion rates for each stage of the funnel using SQL aggregate functions, and update a static chart in a reporting tool.
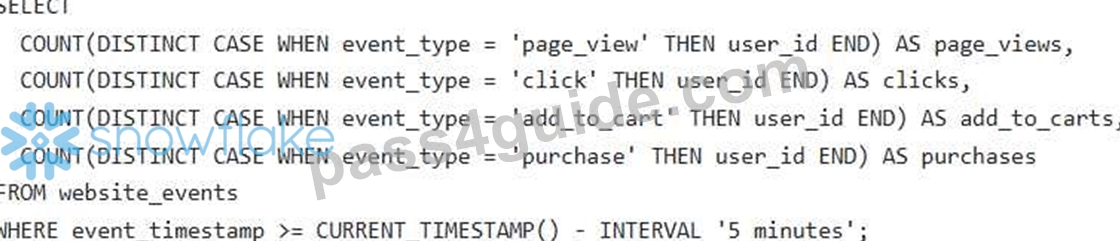
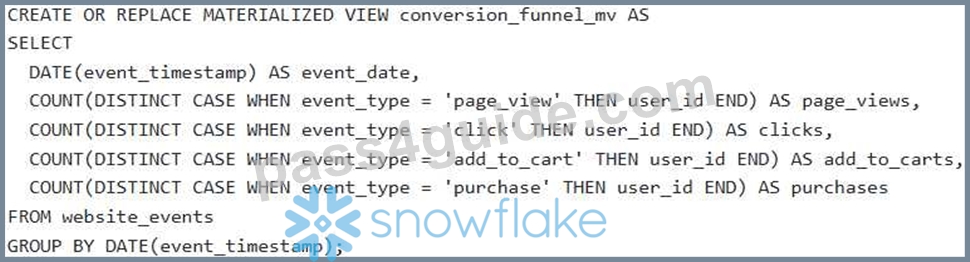
- D. Create a Snowflake Stream on the 'website_events' table. Create a Snowpipe to ingest data, and build a materialized view that pre-calculates the conversion funnel metrics. Connect a real-time dashboarding tool (e.g., Apache Superset, Grafana) to the materialized view to display the funnel in real-time.
- E. Create a Snowflake Stream on the 'website_events' table. Develop a Snowpipe to continuously ingest data into the table. Utilize a BI tool like Tableau connected directly to the 'website_events' table. Build several dashboards each for event type.
Answer: D
Explanation:
Option C is the most efficient and scalable. A Snowflake Stream allows you to track changes to the 'website_events' table in real- time. A Snowpipe enables continuous data ingestion. A materialized view pre-calculates the conversion funnel metrics, significantly improving query performance compared to querying the base table directly, especially with high data volumes. Connecting a real-time dashboarding tool to the materialized view provides a real-time view of the funnel. Option A involves periodic querying, which is less real-time and less efficient. Option B suggests direct connection with a BI tool without pre-aggregating the Data, resulting into dashboard performance issue. Option D introduces unnecessary complexity with external message queues and stream processing frameworks. Exporting data to Python dataframe is not scalable for large data volumes.
NEW QUESTION # 27
You are tasked with cleaning a 'COMMENTS table that contains user-generated comments in a column (VARCHAR). The comments often contain HTML tags, excessive whitespace, and potentially malicious scripts. Your goal is to remove all HTML tags, trim leading and trailing whitespace, and escape any remaining HTML entities to prevent script injection vulnerabilities. Which combination of Snowflake scalar functions provides the most robust and secure way to achieve this data cleaning?
- A. SELECT >', FROM COMMENTS;
- B. SELECT TRIM(REGEXP >', FROM COMMENTS;
- C. SELECT >', FROM COMMENTS WHERE
- D. SELECT >', comment_text) FROM COMMENTS;
- E. SELECT TRIM(HTML ENTITY DECODE(REGEXP >', FROM COMMENTS;
Answer: A
Explanation:
Option B is the most robust and secure method. Here's why: 'REGEXP REPLACE(comment_text, Y', "Y: This removes HTML tags. This attempts to parse the remaining text as XML. If there are still any unescaped or malformed HTML entities, this step will help to isolate them and get rid of the tags. If the text cannot be parsed as XML, PARSE_XML returns NULL. '$').$: This extracts the text content of the XML. Crucially, 'XMLGET' inherently performs HTML entity decoding, effectively escaping potentially dangerous characters (e.g., becomes This prevents script injection. This removes leading and trailing whitespace. Option A only removes the HTML tags and trims the text, but doesn't handle HTML entity encoding, and thus it is vulnerable to script injection. Option C is not correct as HTML ENTITY DECODE' is not an existing function in Snowflake. Option D is not correct as the text needs to be cleaned irrespective of whether it contains XML or not. Option E - if parsing the XML returns null then original value gets returned , which we don't want , we would need to make the value NULL.
NEW QUESTION # 28
While loading data into Snowflake using named file formats, a file format defined in which location has precedence?
- A. The table definition
- B. The schema definition
- C. The COPY INTO statement
- D. The stage definition
Answer: C
Explanation:
In the Snowflake data loading hierarchy, understanding the order of precedence for file format options is critical for troubleshooting and automation. Snowflake allows you to define file format options (such as CSV delimiter, header settings, or compression type) at multiple levels: as a standalone named File Format object, within a Stage definition, or directly inside a COPY INTO statement.
When data is loaded, Snowflake evaluates these definitions based on a specific override logic. The COPY INTO statement sits at the top of this hierarchy. This means that any file format options or named file formats explicitly called out in the COPY INTO command will override any conflicting settings defined at the stage or table level. For example, if a stage is defined to expect comma-separated files, but the COPY INTO command specifies a pipe delimiter, Snowflake will use the pipe delimiter for that specific load operation.
Evaluating the Options:
* Options A, B, and C are incorrect because while they provide default behaviors for specific objects or namespaces, they are considered "lower-level" configurations.
* Option D is the 100% correct answer. The COPY INTO statement provides the final, explicit instruction to the query engine. This design allows Data Analysts to use general-purpose stages for various file types by simply specifying the unique format requirements at the time of the execution, providing maximum flexibility in the Data Ingestion workflow.
NEW QUESTION # 29
What steps are typically involved in troubleshooting query performance issues in Snowflake?
(Select all that apply)
- A. Modifying warehouse configurations
- B. Examining Query Profile attributes
- C. Analyzing system hardware for faults
- D. Reviewing query history and usage logs
Answer: A,B,D
Explanation:
Troubleshooting query performance often involves reviewing query history, adjusting warehouse configurations, and examining Query Profile attributes for optimization.
NEW QUESTION # 30
When maintaining reports and dashboards, why is it crucial to configure subscriptions and updates?
- A. They limit data accessibility for effective dashboard usage.
- B. Configuring these features hampers dashboard usability.
- C. They complicate dashboard management without any added benefits.
- D. Subscriptions and updates ensure timely information delivery.
Answer: D
Explanation:
Subscriptions and updates ensure timely information delivery, a crucial aspect of maintaining reports and dashboards.
NEW QUESTION # 31
You are a data analyst at a retail company. You want to enrich your sales data with weather information from the Snowflake Marketplace to analyze the impact of weather conditions on sales. You have a table 'SALES DATA' with columns 'TRANSACTION_DATE (DATE) and 'STORE (INTEGER). You subscribe to a weather data listing from the Snowflake Marketplace that provides weather information by date and location (latitude and longitude). The weather data is in a view called 'WEATHER_DATA' with columns 'DATE' (DATE), 'LATITUDE' (NUMBER), 'LONGITUDE' (NUMBER), and 'TEMPERATURE' (NUMBER). You need to write a SQL query to join these two datasets. However, the 'WEATHER DATA' does not have a 'STORE ID' and requires calculating distance from a known 'STORE LATITUDE' and 'STORE LONGITUDE' stored in a 'STORES' table. Which approach is the MOST efficient and accurate way to enrich 'SALES DATA with 'TEMPERATURE' from 'WEATHER DATA'?
- A. Use a Snowflake UDF (User-Defined Function) that takes 'TRANSACTION_DATE, 'STORE D" , 'STORE_LATITUDE and 'STORE LONGITUDE as input and returns the temperature from the closest weather station in 'WEATHER_DATA' by calculating the Haversine distance within the UDF.
- B. Create a stored procedure that iterates through each row in 'SALES_DATX , calculates the distance to each weather station in 'WEATHER_DATR , finds the closest weather station, and updates a new 'SALES DATA ENRICHED' table with the temperature. This can be done using the Haversine formula.
- C. Create a view that joins 'SALES DATA' with 'WEATHER DATA' using the 'DATE column. Then, update this view with 'STORE LATITUDE' and ' STORE_LONGITUDE by joining 'SALES_DATA' with the 'STORES' table. Finally, implement a 'CASE statement within the view to calculate the temperature based on the 'LATITUDE and 'LONGITUDE of each store and weather station.
- D. create a new table 'STORE_LOCATIONS' by querying the 'STORES' table that maps 'STORE_ID to 'LATITUDE and 'LONGITUDE. Then, use a CROSS JOIN to create all combinations of 'SALES_DATR, 'STORE_LOCATIONS, and 'WEATHER_DATR and filter based on the proximity (e.g., within 5km) of the store to the weather station using the Haversine formula. Finally, select the closest weather station by using QUALIFY ROW_NUMBER() OVER (PARTITION BY TRANSACTION_DATE, STORE_ID ORDER BY DISTANCE ASC) = 1 .
- E. Join 'SALES_DATX and 'WEATHER_DATX directly on ' TRANSACTION_DATE = 'DATE. Calculate average temperature across all locations for each day to account for location differences. This approach assumes temperature variations are minimal across locations.
Answer: D
Explanation:
Option C is the most efficient and accurate. Creating a table allows us to pre-calculate store locations. Then, using a 'CROSS JOIN' avoids nested loops, and filtering using the Haversine formula provides accurate proximity-based matching. 'QUALIFY' ensures you select only the closest weather station. Option A is inaccurate as it averages temperatures across all locations. Option B is inefficient due to row-by-row processing within a stored procedure. Option D, while potentially accurate, can suffer from performance issues associated with UDFs, especially when dealing with a large volume of data. Option E is incorrect as you can't update a View directly and the case statement will be difficult to maintain. The Haversine formula calculates the great-circle distance between two points on a sphere given their longitudes and latitudes.
NEW QUESTION # 32
How can incorporating visualizations in reports and dashboards facilitate better data comprehension and analysis for business use scenarios?
- A. Visualizations limit data exploration and analysis capabilities.
- B. Visualizations don't impact data comprehension or analysis significantly.
- C. Presenting data visually increases complexity in analysis.
- D. They enhance data comprehension, aiding effective analysis.
Answer: D
Explanation:
Visualizations enhance data comprehension, aiding effective analysis in business use scenarios.
NEW QUESTION # 33
When maintaining reports and dashboards, why is it essential to configure subscriptions and updates?
- A. They limit data accessibility for effective dashboard usage.
- B. Configuring these features hampers dashboard usability.
- C. They complicate dashboard management without any added benefits.
- D. Subscriptions and updates ensure timely information delivery.
Answer: D
Explanation:
Subscriptions and updates ensure timely information delivery, a crucial aspect of maintaining reports and dashboards.
NEW QUESTION # 34
When managing Snowsight dashboards, what role do subscriptions and updates play in meeting business requirements?
- A. Managing subscriptions and updates complicates dashboard usage.
- B. They enhance dashboard usability without impacting data updates.
- C. Subscriptions and updates ensure timely information delivery.
- D. Subscriptions and updates don't impact dashboard management.
Answer: C
Explanation:
Subscriptions and updates ensure timely information delivery, meeting business requirements.
NEW QUESTION # 35
You are examining sales data for an e-commerce company in Snowflake. You notice a recurring dip in sales every Wednesday. The 'SALES' table contains columns: 'order_id', 'order date' , 'product_id', 'quantity', 'price'. Which of the following SQL queries and analytical techniques would be the MOST effective for diagnosing the reasons behind this weekly sales dip, assuming no external promotional activity always happens on Wednesdays?
- A. Run a query to calculate the average daily sales for each day of the week and visualize the results to confirm the dip on Wednesdays. Use "DAYOFWEEK' function for this.
- B. Check if there are any scheduled maintenance windows or system outages occurring on Wednesdays that might be affecting order processing. Use 'INFORMATION SCHEMA.LOAD HISTORY' to look for any loads failing on wednesdays
- C. Analyze sales patterns by 'product_id' and day of the week to see if specific product categories are driving the overall dip on Wednesdays. Use 'PIVOT' operator for cross-tabulation.
- D. Review recent code deployments related to the e-commerce platform and identify if any changes were implemented on Tuesdays or Wednesdays that could be impacting sales.
- E. Investigate shipping times by day of the week to determine if longer shipping times on orders placed earlier in the week are affecting Wednesday sales. Join ' SALES table with 'SHIPPING' table and calculate difference between 'order_date' and 'ship_date' .
Answer: A,C,D,E
Explanation:
Options A, B, C, and E are the most relevant. Option A helps confirm the dip. Option B identifies product-specific patterns. Option C investigates a potential shipping-related cause. Option E explores potential software changes, while Option D focuses on a possible but less relevant cause of system maintenance.
NEW QUESTION # 36
You are analyzing sales data for a retail company. The 'sales' table contains columns 'product id' (INT), 'sale date' (DATE), and 'sale_amount' (NUMBER). You need to calculate the percentage contribution of each product's sales to the total sales on each day. You want the result to include 'sale date', 'product_id', 'sale_amount', 'daily total' , and 'percentage_contribution'. Which of the following Snowflake queries achieves this correctly?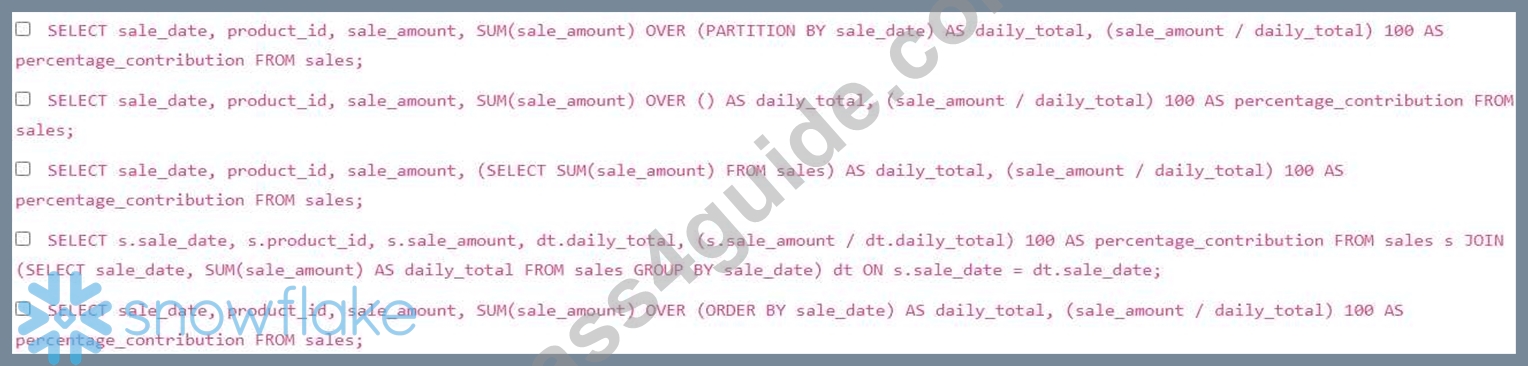
- A. Option A
- B. Option C
- C. Option D
- D. Option E
- E. Option B
Answer: A,C
Explanation:
Options A and D are correct. Option A uses a window function OVER (PARTITION BY to calculate the total sales for each day. This is efficient because it calculates the total sales for each day in a single pass. Option D uses a subquery to calculate the total sales for each day and then joins this result back to the original table. Option B calculates a single total over the entire table, not by day. Option C calculates a single total sales amount over the entire table and assigns it to every row, which is incorrect. Option E orders the sales amount by the date but doesnt correctly partition by 'sale_date' leading to cumulative sum instead.
NEW QUESTION # 37
What functions should a Data Analyst use to run descriptive analytics on a data set? (Select TWO).
- A. REGR_INTERCEPT
- B. AVG
- C. REGR_SLOPE
- D. APPROX_COUNT_DISTINCT
- E. ROW_NUMBER
Answer: B,D
Explanation:
Descriptive analytics is the process of using historical data to understand "what happened." This typically involves summarizing large datasets into interpretable chunks using central tendency, dispersion, and frequency measures.
AVG (Average) is a cornerstone of descriptive statistics. It provides the arithmetic mean of a numeric column, allowing an analyst to understand the "typical" value within a dataset (e.g., Average Order Value).
APPROX_COUNT_DISTINCT is a descriptive tool used to understand the volume of unique entities within a dataset (e.g., "How many unique customers visited the site?"). Similar to HLL mentioned earlier, this function provides a fast summary of data volume and variety, which is a primary goal of the descriptive phase of analysis.
Evaluating the Options:
* Options A and B (REGR_INTERCEPT and REGR_SLOPE) are used for linear regression. These fall under Predictive Analytics, as they are used to model relationships and predict future outcomes, rather than just describing current data.
* Option C (ROW_NUMBER) is a window function used for data ranking and ordering, but it does not provide a descriptive summary of the dataset's characteristics.
* Options D and E are correct because they provide summary statistics (mean and cardinality) that define the "state" of the data, which is the definition of descriptive analytics.
NEW QUESTION # 38
When selecting and implementing an effective data model, what considerations are crucial for ensuring its suitability for BI requirements? (Select all that apply)
- A. Extensive data denormalization
- B. Scalability and flexibility
- C. Performance and ease of maintenance
- D. Conformity to specific database standards only
Answer: B,C
Explanation:
Effective data models should ensure scalability, flexibility, good performance, and ease of maintenance to meet BI requirements effectively.
NEW QUESTION # 39
When designing a data collection system, what factors should be considered when assessing how often data needs to be collected? (Select all that apply)
- A. Data collection tool limitations
- B. Data source availability
- C. Volume of data
- D. Business requirements
Answer: C,D
Explanation:
Assessing data collection frequency involves considering business requirements and the volume of data necessary for analysis.
NEW QUESTION # 40
You are tasked with loading multiple CSV files from an external stage into a Snowflake table. The files have the following naming convention: HHMlSS.csv' (e.g., 'data_20240101 120000.csv'). You need to load all the files that were created on or after '2024-01-01' into the 'target_table'. Which of the following approaches can be used to load those data?
- A. Using a single COPY INTO statement with a wildcard pattern in the file path and filtering in a subsequent INSERT INTO statement using a WHERE clause on the filename derived from METADATA$FILENAME.
- B. Using a Snowpipe with a file notification integration, configuring the notification to trigger only for files created on or after '2024-01-01'.
- C. Using a single COPY INTO statement with a pattern match against METADATA$FILENAM The matching logic is done inline with the COPY INTO statement using regex.
- D. Using a loop with dynamic SQL to construct COPY INTO statements for each matching file based on the date substring.
- E. Using a Snowflake task that runs daily, retrieves all the file names from the stage, filters the file names based on created date and loops through each filtered file name to load them
Answer: A,C
Explanation:
Option B is a viable solution. COPY INTO can be combined with METADATA$FILENAME filtering to load files matching a criteria. Option E provides a better, more efficient solution that leverages the 'METADATA$FILENAME' pseudo-column to filter files directly within the 'COPY INTO' statement using regular expressions or string functions to extract and compare the date from the filename. Option A will work but is very inefficient. Option C will work, but complex to maintain. Option D is more complex to setup than option E. Snowpipe generally does not accept a single COPY command but rather an ongoing copy operation
NEW QUESTION # 41
What role do secure views play in data analysis practices?
- A. They prevent the creation of materialized views.
- B. Secure views offer enhanced data security while allowing selective data access.
- C. They don't impact data security but significantly enhance query performance.
- D. Secure views limit access to data, hindering analysis.
Answer: B
Explanation:
Secure views enhance data security by allowing selective data access while benefiting analysis.
NEW QUESTION # 42
You are tasked with loading data from an S3 bucket into a Snowflake table named 'SALES DATA'. The data is in CSV format, compressed with gzip, and contains a header row The S3 bucket requires AWS IAM role authentication. The 'SALES DATA' table already exists, and you want to use a named stage for this ingestion process. Which of the following steps are necessary to successfully load the data, minimizing administrative overhead?
- A. Create an external function to read the data from S3 and then insert it into the table, as Snowflake cannot directly read gzipped CSV files from S3.
- B. Grant usage privilege on the storage integration to the role performing the data load. Ensure the user loading data has access to the Snowflake stage and the ' INSERT privilege on the table.
- C. Ensure the S3 bucket has public read access; Snowflake's COPY INTO command will handle decompression and data loading without further configuration.
- D. Create a new IAM role in AWS with access to the S3 bucket, then create a Snowflake storage integration object referencing that role's ARN and the S3 bucket's URL.
- E. Create a Snowflake stage object that references the storage integration, the S3 bucket URL, and specifies the file format (CSV with gzip compression and header skip). Use the 'COPY INTO' command referencing the stage.
Answer: B,D,E
Explanation:
Options A, B, and D are correct. Option A: Snowflake needs an IAM role and storage integration to access the S3 bucket securely. Option B: A stage object simplifies the COPY INTO command and handles file format details. Option D: Correct permissions are required for the data load to succeed. Option C is incorrect because Snowflake can directly read gzipped CSV files from S3 when configured correctly. Option E is incorrect because granting public read access to the S3 bucket is a security risk and is not the best practice; using IAM roles provides controlled and secure access.
NEW QUESTION # 43
......
Validate your DAA-C01 Exam Preparation with DAA-C01 Practice Test: https://www.pass4guide.com/DAA-C01-exam-guide-torrent.html
Get all the Information About Snowflake DAA-C01 Exam 2026 Practice Test Questions: https://drive.google.com/open?id=14bEVo-ylvnJ84ndMLhc1Xv5hb7J1xOwZ